Sometimes you may want to analyze and view trends in your data without creating an entire chart. Sparklines are miniature charts that fit into a single cell. Because they're so compact, it's easy to include several sparklines in a sheet.
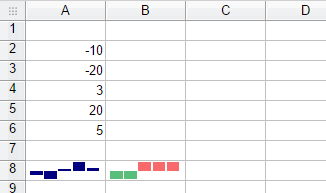
There are three different types of sparklines: Line, Column, and Win/Loss. Line and Column work the same as line and column charts. Win/Loss is similar to Column, except it only shows whether each value is positive or negative instead of how high or low the values are. All three types can display markers at important points, such as the highest and lowest points, to make them easier to read.
Sparklines are ideal for situations when you need a clear overview of the data at a glance and when you don't need all of the features of a full chart. On the other hand, charts are ideal for situations when you want to represent the data in greater detail, and they are often better for comparing different data series.
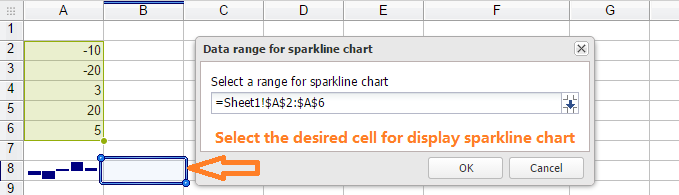
Follow the steps to create the sparkline chart for your selected cell.
Select the cell with sparkline chart. From the title bar, select Format -> Clean -> Clear all button, you can remove the sparkline chart.