Get a demo
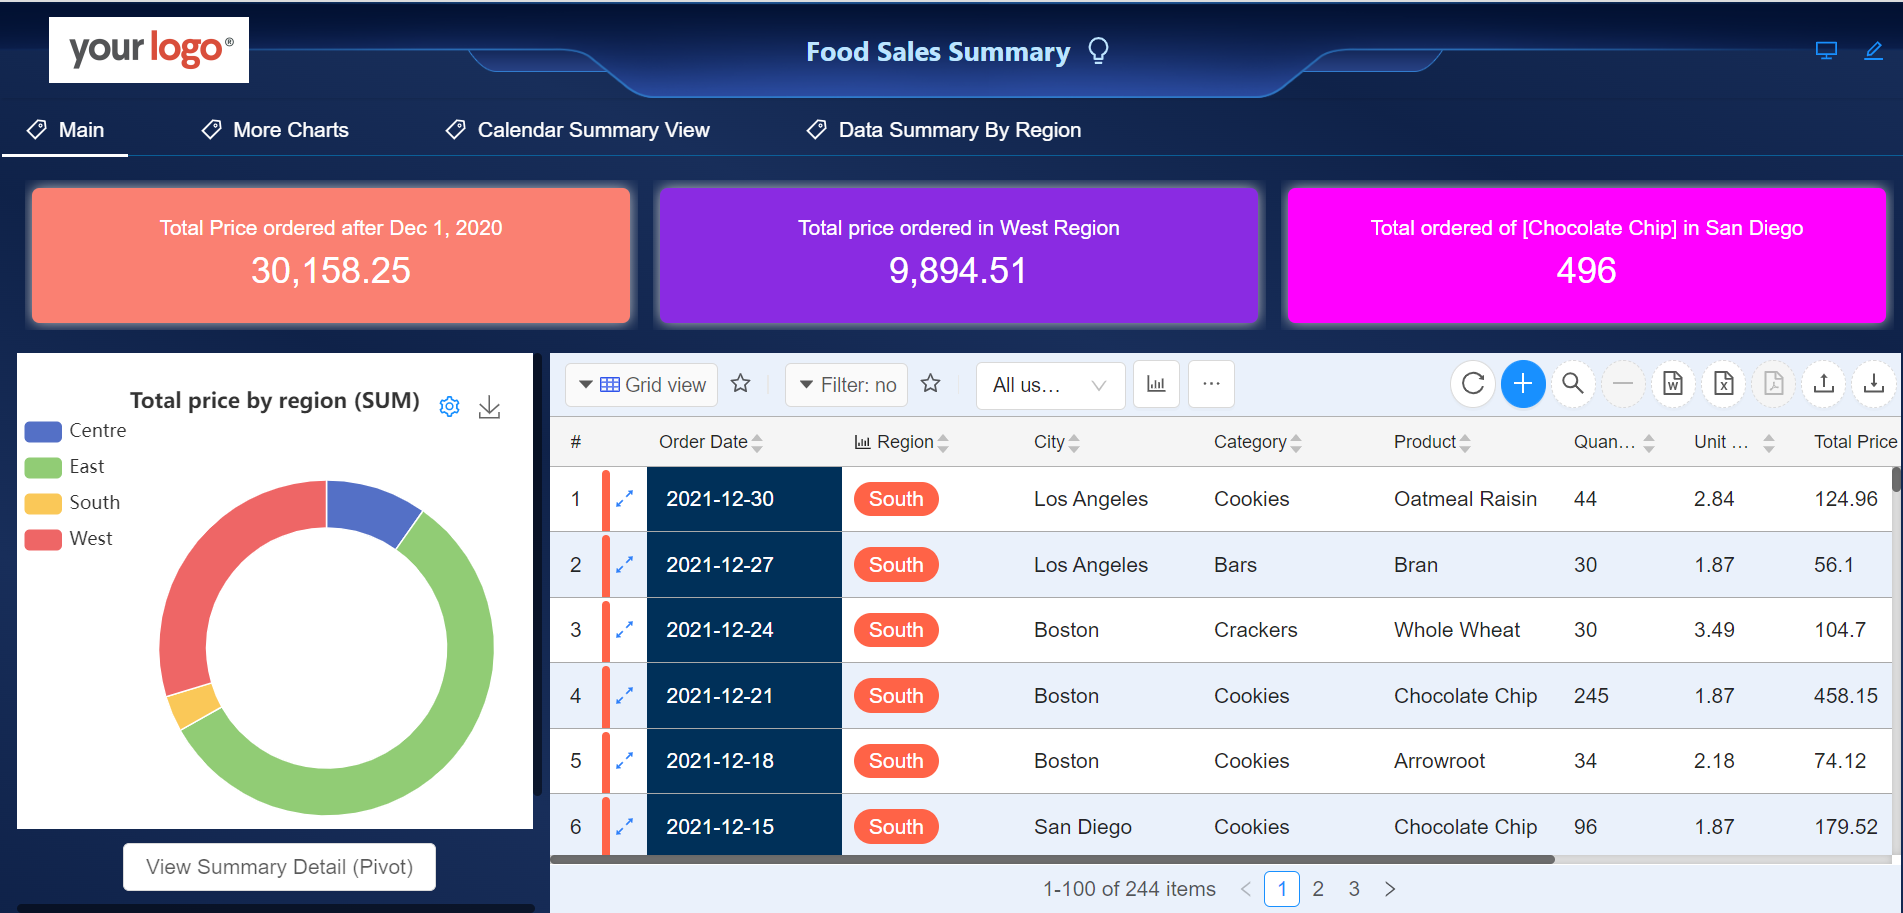
The Food Sales Summary is a super handy breakdown of gross food sales, net sales, discounts, fees, refunds, taxes, gratuity—all neatly organized for your records. With the ability to filter by provider as well as date range, this example is here to help business keep tabs on business trends, giving the business all the ins and outs of their sales.
Business can easily upload the Excel file and convert them into form data to process data summary analyze.
Summary based on the customized conditions
CubeDrive allows business setup the special summary based on the customized conditions. For example:
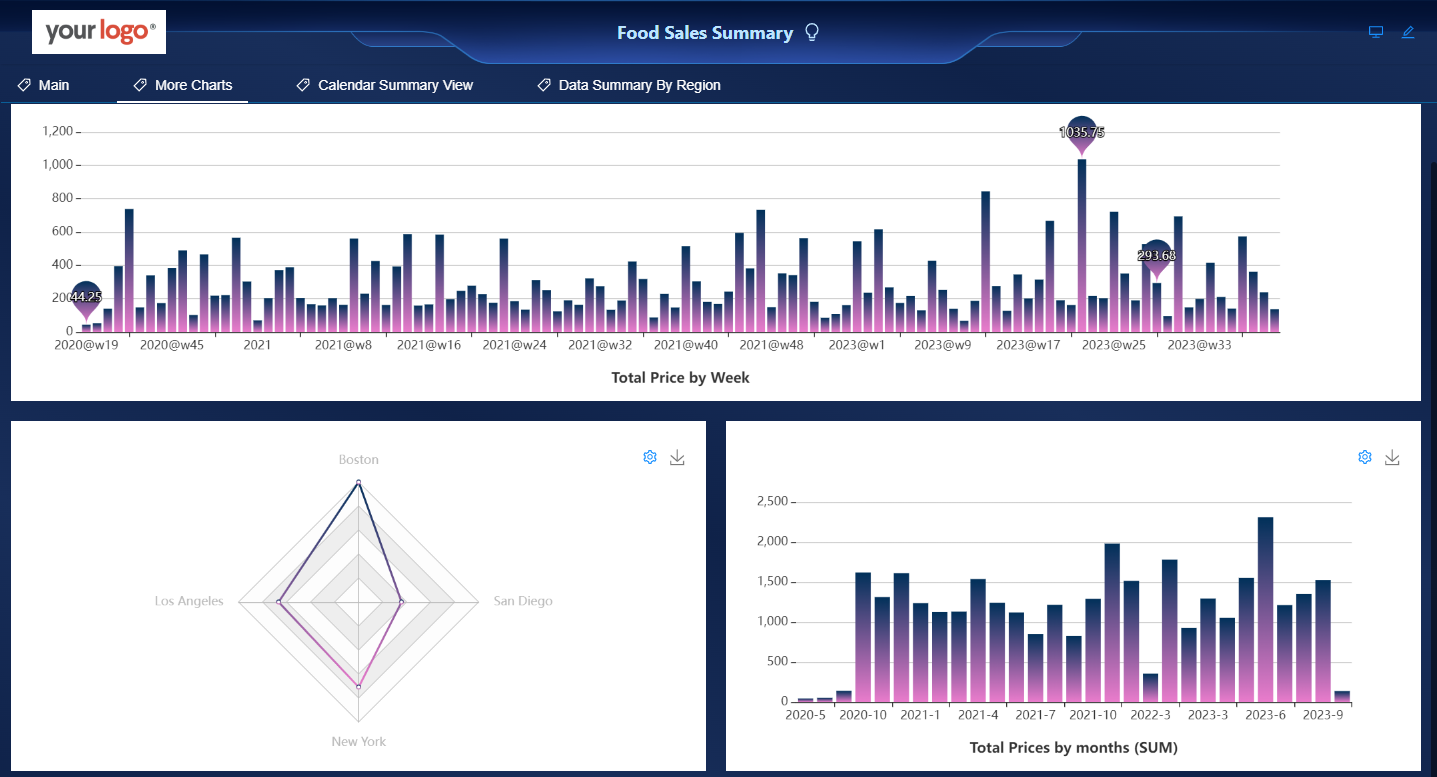
Charts summary
CubeDrive provides a list of charts which allows the business to analyze their data easily.
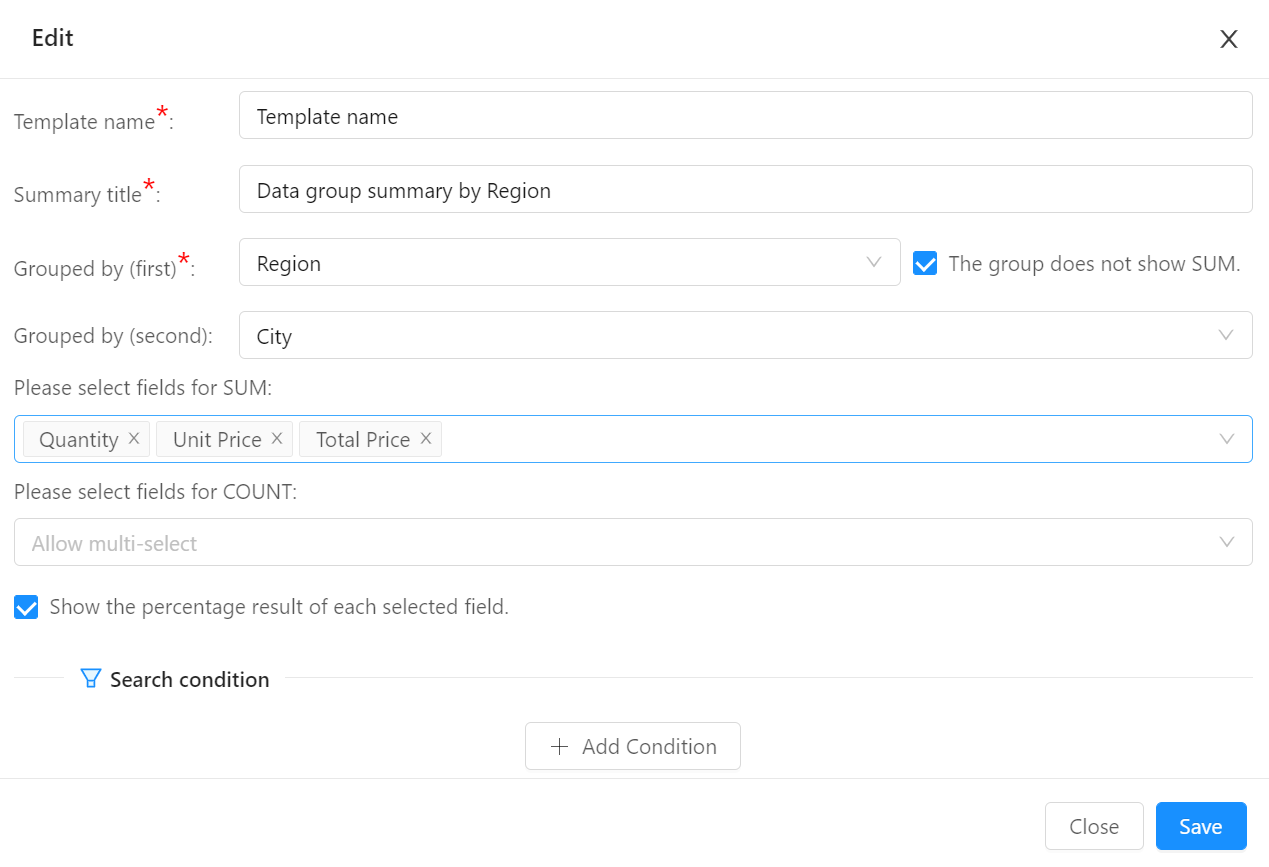
Pivot table data summary in Sheet format
Business data can also be analyzed with the customized pivot table.
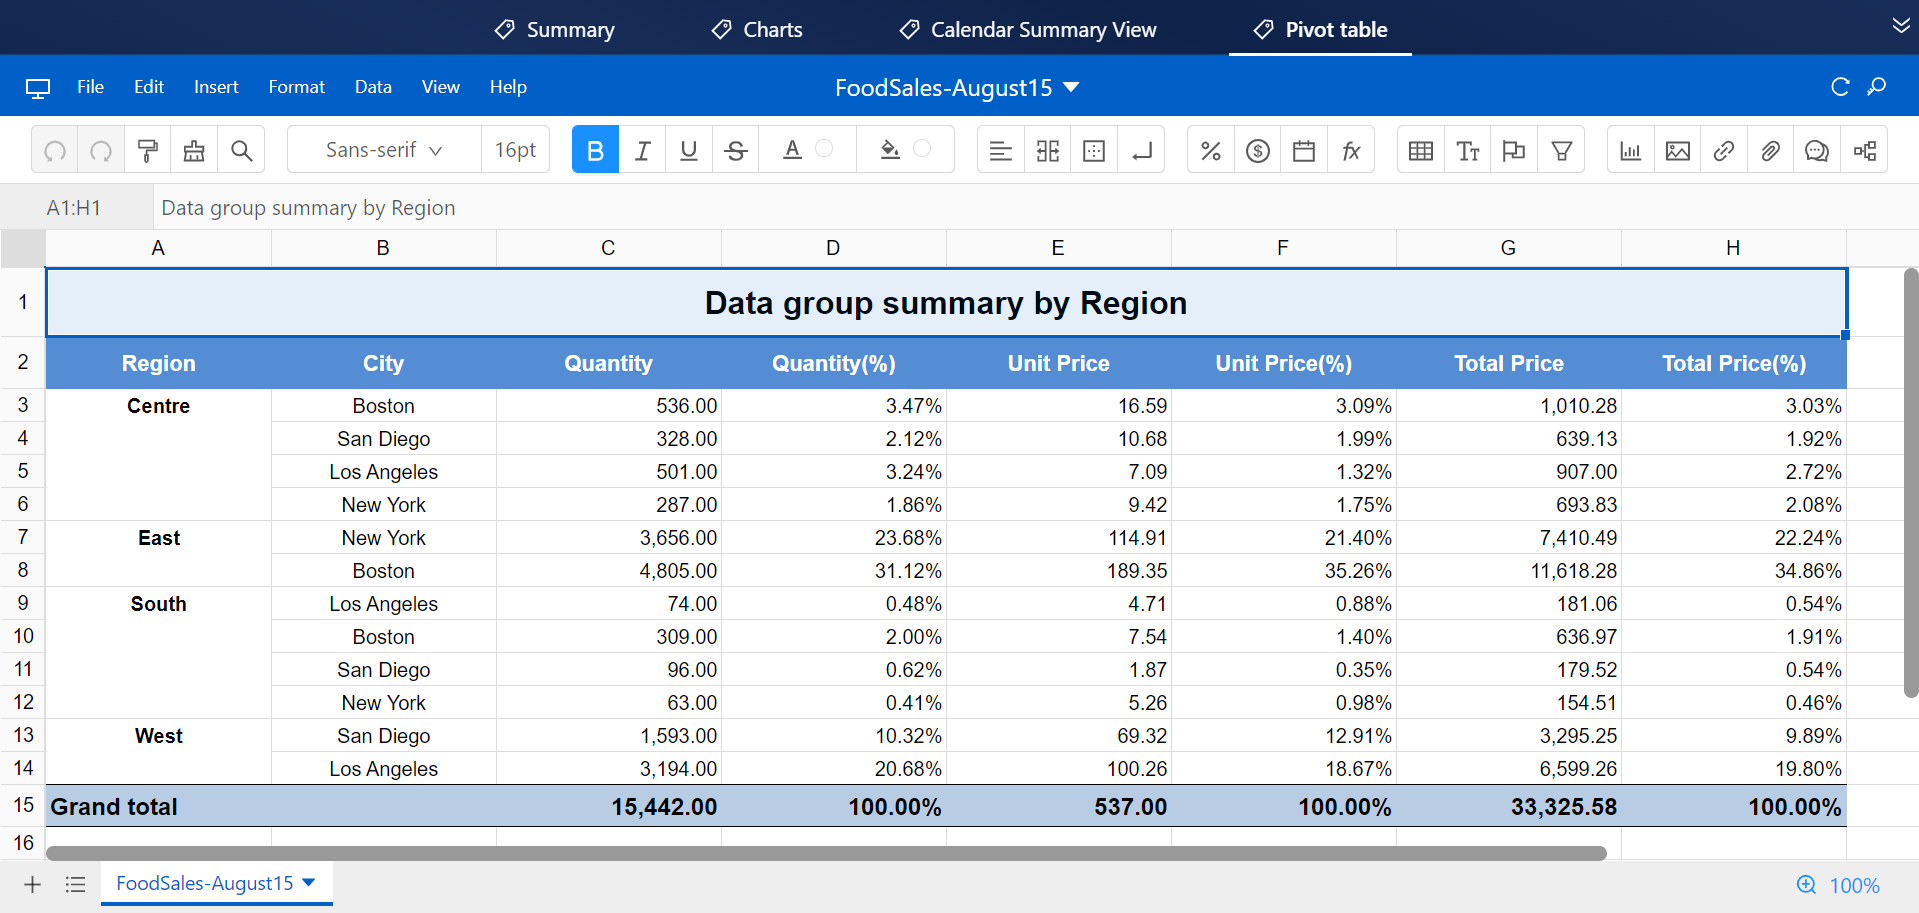
User can select different form fields for group, select fields for sum/count. See the following setup for more details.
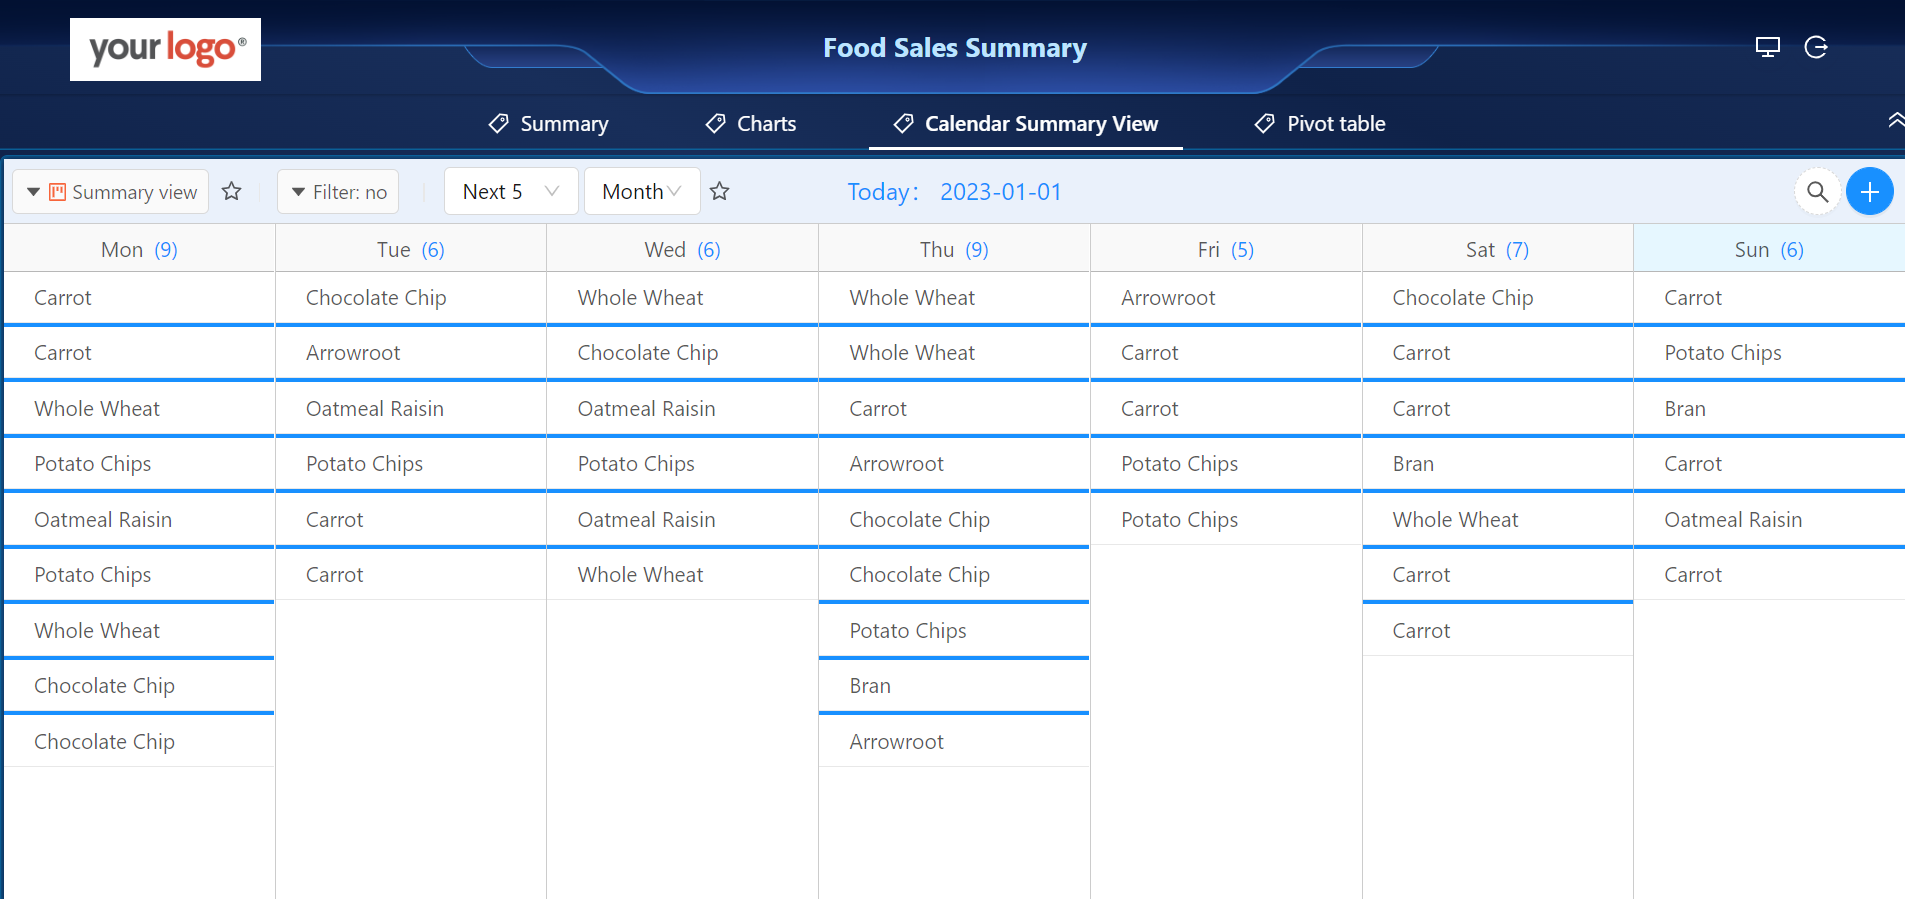
Calendar summary view
Food sales data can be viewed in calendar summary format.