Product sale daily analyze
Keywords: Data analysis; Dynamic chart;
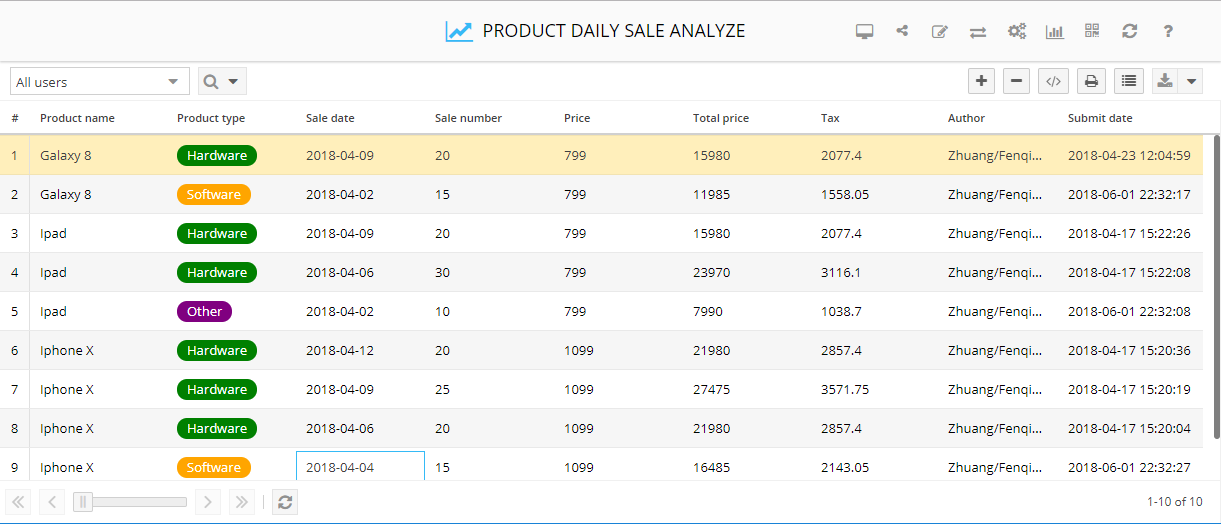
This is an application which allows customer to add daily product sale result. Base on the input date, the analyze result will be displayed to customer for further action.
Create product sale form
Login to the CubeDrive site. Click "+ Create Form" button to start build a form. Enter a list of fields in the form and click "Create form link", a form is generated online. If you are system administrator, you can also auto generate form from copied json data in the admin console page.
Setup condition to analyze data
Click form panel top right icon , you can start to generate different kind of chart based on your selected condition.
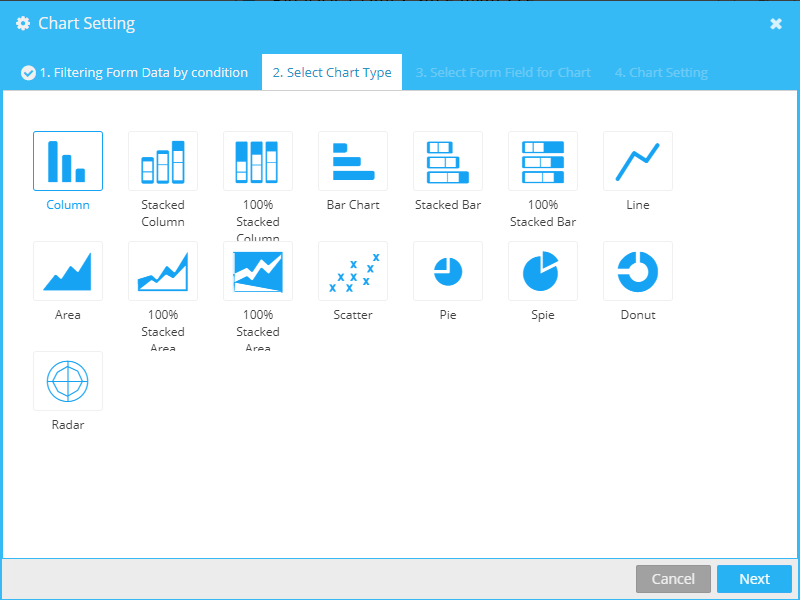
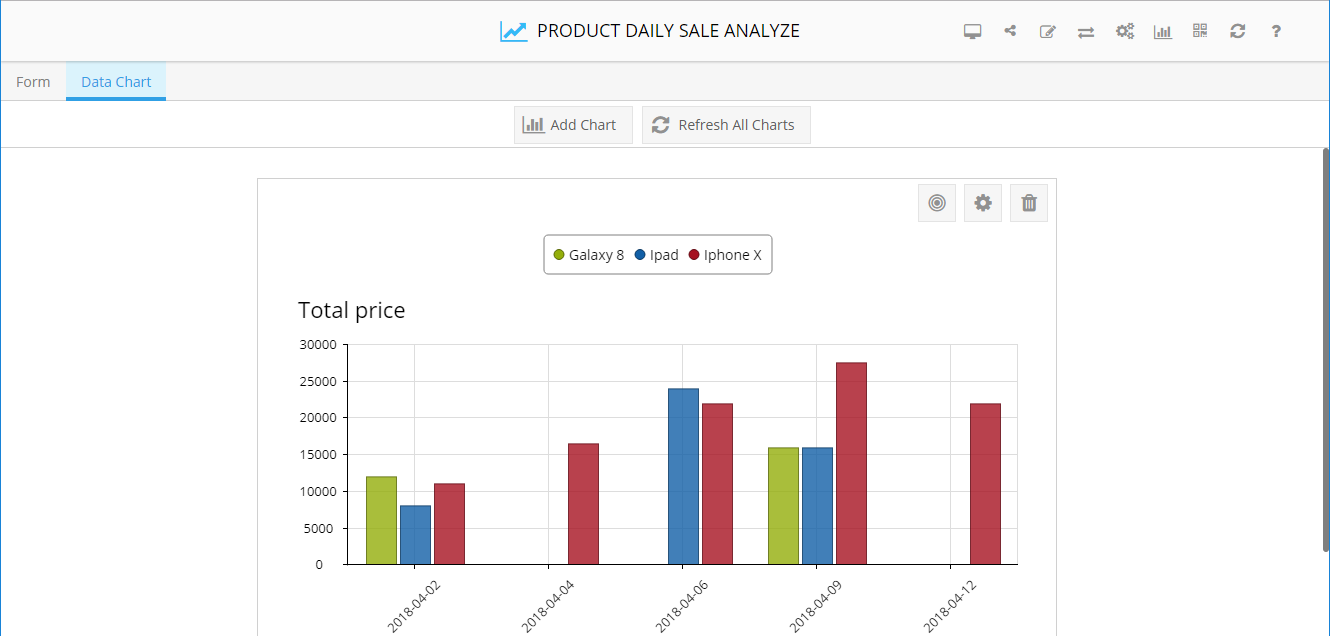
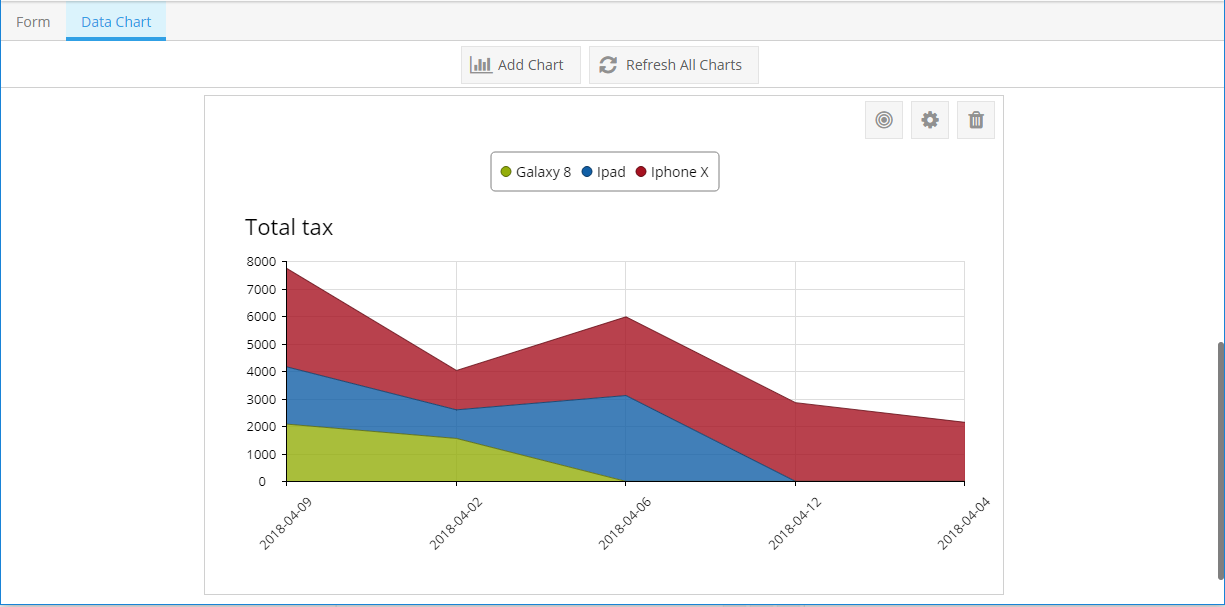
Chart result
Based on the condition setup, you can get the different result as your needs.
View template Use template Back